Disease and Injury
Diabetes Incidence
Number of Manitoba Residents Newly Diagnosed with Diabetes
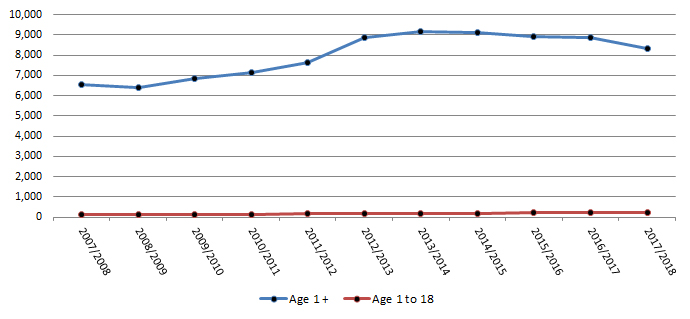
| 2008/ 2009 |
2009/ 2010 |
2010/ 2011 |
2011/ 2012 |
2012/ 2013 |
2013/ 2014 |
2014/ 2015 |
2015/ 2016 |
2016/ 2017 |
2017/ 2018 |
||
| Age 1 + | 6,419 | 6,860 | 7,154 | 7,644 | 8,853 | 9,185 | 9,095 | 8,900 | 8,853 | 8,347 | |
| Age 1 to 18 | 135 | 155 | 153 | 176 | 161 | 178 | 192 | 207 | 211 | 224 | |
Please note that because diabetes incidence rates, and diabetes and hypertension prevalence rates, have multi-year and/or multiple-health-system-encounter definition thresholds, values may change from submission year to submission year and thus may not match previously-reported figures.
Diabetes Prevalence
Number and Percentage of Manitoba Residents Living with Diabetes, age 1 and older
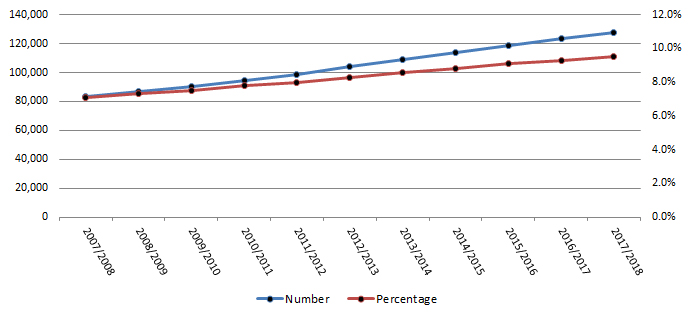
| 2007/ 2008 |
2008/ 2009 |
2009/ 2010 |
2010/ 2011 |
2011/ 2012 |
2012/ 2013 |
2013/ 2014 |
2014/ 2015 |
2015/ 2016 |
2016/ 2017 |
2017/ 2018 |
|
| Number | 83,550 | 86,689 | 90,399 | 94,317 | 98,537 | 103,831 | 109,289 | 114,015 | 118,734 | 123,345 | 127,330 |
| Percentage | 7.1% | 7.3% | 7.5% | 7.8% | 8.0% | 8.3% | 8.6% | 8.8% | 9.1% | 9.3% | 9.5% |
Number and Percentage of Manitoba Residents Living with Diabetes, age 1 to 18
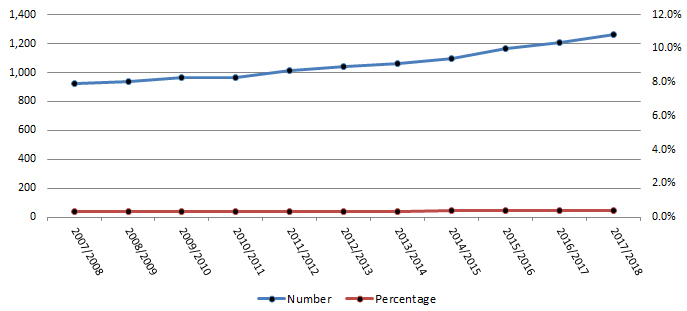
| 2008/ 2009 |
2009/ 2010 |
2010/ 2011 |
2011/ 2012 |
2012/ 2013 |
2013/ 2014 |
2014/ 2015 |
2015/ 2016 |
2016/ 2017 |
2017/ 2018 |
||
| Number | 935 | 965 | 969 | 1,012 | 1,043 | 1,059 | 1,095 | 1,164 | 1,208 | 1,263 | |
| Percentage | 0.33% | 0.34% | 0.34% | 0.35% | 0.35% | 0.36% | 0.37% | 0.39% | 0.40% | 0.41% | |
Please note that because diabetes incidence rates, and diabetes and hypertension prevalence rates, have multi-year and/or multiple-health-system-encounter definition thresholds, values may change from submission year to submission year and thus may not match previously-reported figures.
Hypertension Prevalence
Number and Percentage of Manitoba Residents Living with Hypertension, age 20 and older
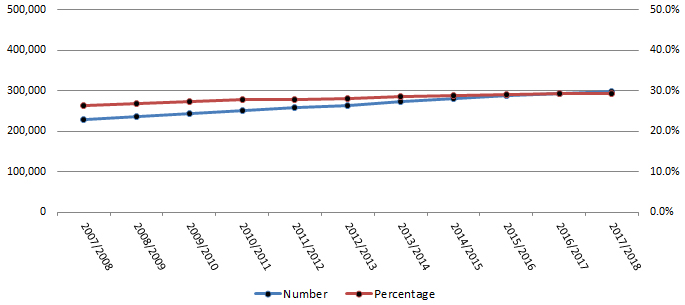
| 2008/ 2009 |
2009/ 2010 |
2010/ 2011 |
2011/ 2012 |
2012/ 2013 |
2013/ 2014 |
2014/ 2015 |
2015/ 2016 |
2016/ 2017 |
2017/ 2018 |
||
| Number | 236,424 | 243,743 | 251,025 | 258,023 | 264,130 | 273,347 | 281,160 | 287,030 | 292,522 | 298,373 | |
| Percentage | 26.9% | 27.3% | 27.7% | 27.9% | 28.0% | 28.5% | 28.9% | 29.1% | 29.2% | 29.4% | |
Please note that because diabetes incidence rates, and diabetes and hypertension prevalence rates, have multi-year and/or multiple-health-system-encounter definition thresholds, values may change from submission year to submission year and thus may not match previously-reported figures.
Injury Hospitalizations
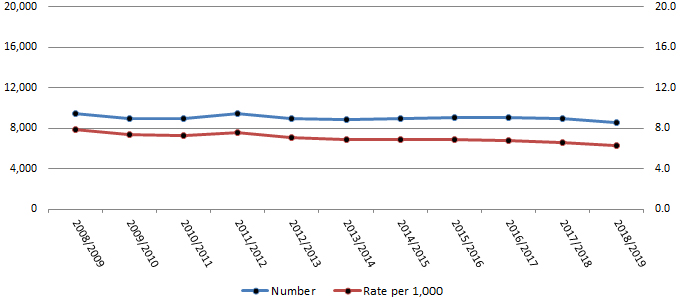
Number and Rate per 1,000 of Injury Hospitalizations for Manitoba Residents
| 2009/ 2010 |
2010/ 2011 |
2011/ 2012 |
2012/ 2013 |
2013/ 2014 |
2014/ 2015 |
2015/ 2016 |
2016/ 2017 |
2017/ 2018 |
2018/ 2019 |
||
| Number | 8,991 | 8,983 | 9,474 | 8,961 | 8,839 | 8,958 | 9,080 | 9,086 | 8,984 | 8,601 | |
| Percentage | 7.4 | 7.3 | 7.6 | 7.1 | 6.9 | 6.9 | 6.9 | 6.8 | 6.6 | 6.3 | |
Any inquiries pertaining to these quick stats should be addressed to: Information Management & Analytics |


